Updated: Dec 20, 2019
Whether you have an eCommerce shop, are offering services, or selling tickets to an event, having a clear understanding of how potential customers are interacting with your website (and yes, you absolutely need a website) is essential for making literally any future online marketing campaign a success. In this post we’ll walk you through 5 easy reports that will help you analyze how visitors are engaging with your website – all using Google’s most powerful reporting tool and the reason we’re excited to wake up every morning, Google Analytics. #turninsightsintoaction #justdoit
What is Google Analytics?
Glad you asked! Google Analytics is a free – that’s right, FREE – Google product that your web developer, or you (no seriously, you can do it yourself), can connect to any website to collect visitor data. In fact, a majority of eCommerce and website platforms make it extremely easy to install on your site with just a quick copy and paste of some code (don’t freak out!). For help installing yourself visit Google’s Support Center.
Once installed you’ll have access to dozens of reporting tools ranging from location of your visitors to how long they are spending on your landing pages. Here are the top 5 reports you can generate with the abundance of data this tool collects – note: in the digital world, data is BAE – along with their importance and why you’re crazy if you don’t do it. Like, now.
1. Acquisition Overview
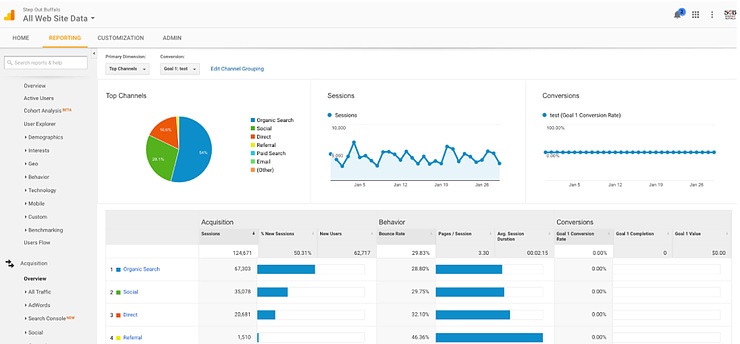
Find this report by going to “Acquisition” —> “Overview” in your left sidebar menu.
This overview gives you a bird’s eye view of your visitors and more importantly where they come from. For example, here’s a screenshot from date range 12/29/17 – 1/29/17 from StepOutBuffalo.com. As you can see from the multi color pie chart detailing our traffic sources, 28.1% of visitors are coming from social media sites (think Facebook, Twitter, etc.) and 54% are coming from “Organic Search” (AKA people typing in their thoughts on google and finding their way to our page).
How this helps: Taking a look at traffic patterns and sources over different date ranges will help you distinguish seasonal trends and what platforms your visitors are finding you on. Double down on that shit.
2. Audience Location
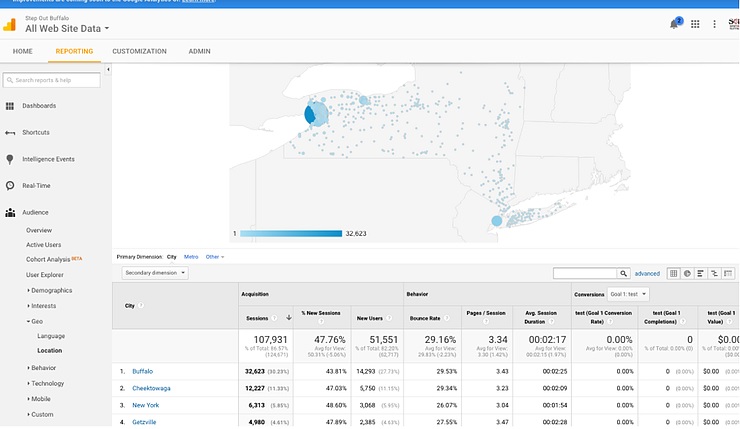
Find this report by going to “Audience” —> “Geo” —> “Location”.
With StepOutBuffalo.com being a regional media publication this is one of our most useful reports, as it details everything from the state down to the city, and town where our readers are located, giving us a clear picture of what our distribution looks like over any given date range. This information helps us determine everything from targeting social media ads to helping local advertisers target their ad campaigns run on our site.
How this helps: No matter your business’s size or scope, knowing where your potential customers are from is a solid and necessary foundation for any targeted marketing campaign.
3. Top Landing Pages
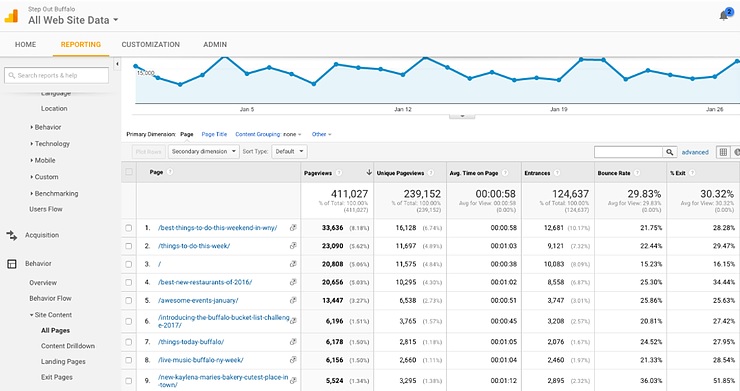
Find this report by going to “Behavior” —> “Site Content” —> “All Pages”
This section will outline the top visited landing pages on your website over any date range you want, including information on exact pageviews and the average amount of time spent on a particular landing page. The ways to use this info to your advantage are endless, including improving a landing page with a high “exit rate” or “bounce rate” by redesigning it or sharing a landing page or piece of content that your readers seem to like on social media for extra engagement. For example, after reviewing our top landing pages on StepOutBuffalo.com in the early days, we discovered our “Best Things To Do This Weekend in WNY” page was by far our most visited landing page with over 30,000 visitors a month: a clear signal to our content creators to continue sharing more info about things to do on weekends.
How this helps: This will help you determine what content on your website is being viewed, and what’s not. Consider doubling down on content, time, and or resources for the stuff that’s working and start phasing out (or at least keeping an eye on) the stuff that’s not.
4. Exit Pages
Find this report by going to “Behavior” —> “Site Content” —> “Exit Pages”
We’ve already taken a look at how people are coming to your site through your acquisition overview and top landing pages. But did you know that it’s equally as important to know where / when / why your visitors are leaving? Cause it is.
How this helps: This report – bless it’s heart – will help you understand what sections of your website need some TLC. For example if lots of people are exiting on your homepage or through a checkout landing page you may want to consider a redesign, or changing your shipping rates to encourage customers to complete their online order. There are also a lot of exit pages that you want see – such as “thank you” pages or order completion pages. You can even set up goals in Analytics to notify you when one of your desired exit pages is achieved by creating a goal. Go big or go home, that’s what we always say. And nothing says big like sleighing goals and taking names with Google Analytics.
5. Real Time
Find this report by going to “Real-Time” —> “Overview”
Ok, so we’ll warn you that if you believe in big brother conspiracies you may find this a little alarming, however for us marketers it’s one of our favorite tool, and like I said before, is one of the reasons we wake up excited every morning.
Hey, there’s nothing like the rush of posting awesome content to your Facebook page and seeing your real time number soar past your daily averages. #thrilling
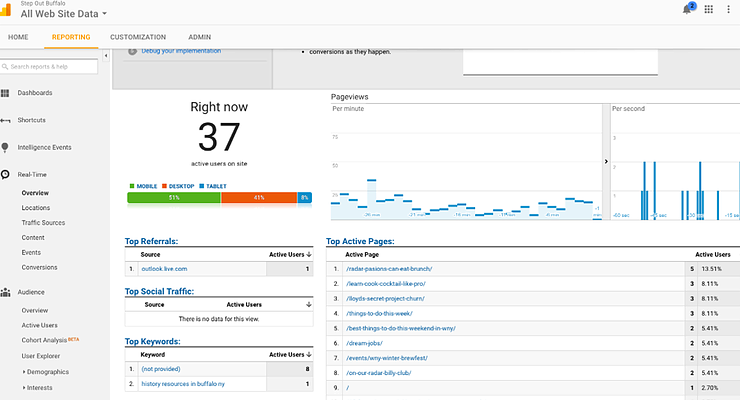
How this helps: This report gives you an overview of your website visitors in real time, detailing what landing page they are on, what traffic source (Facebook, Instagram, Google, etc.) they came from, and where they are located.
Below is a screenshot from StepOutBuffalo.com on January 20, 2017 at exactly 1:01pm. You’ll see at this exact time we had 37 people viewing our site, 7 of which were reading about a new brunch article we had published two days ago. Be careful, this report never gets old and can cause you to lose focus on all other things. 🙂
Happy data mining!
Want to know more about promoting your business on StepOutBuffalo.com? Contact us!
At Step Out Buffalo, we help businesses promote themselves and their events on our website, email, and social media channels. Our team is comprised of experts who know exactly how to make your business or event stand out, and we’ll put you in all the right places so you get noticed by all the right people. Hit us up if you’d like to learn more about our business and/or events-based promotions – there’s a reason 94% of our readers go places they’ve seen on StepOutBuffalo.com


